Crop Load Management Update (5/13/20): Rescue Thinning
go.ncsu.edu/readext?690774
en Español / em Português
El inglés es el idioma de control de esta página. En la medida en que haya algún conflicto entre la traducción al inglés y la traducción, el inglés prevalece.
Al hacer clic en el enlace de traducción se activa un servicio de traducción gratuito para convertir la página al español. Al igual que con cualquier traducción por Internet, la conversión no es sensible al contexto y puede que no traduzca el texto en su significado original. NC State Extension no garantiza la exactitud del texto traducido. Por favor, tenga en cuenta que algunas aplicaciones y/o servicios pueden no funcionar como se espera cuando se traducen.
Português
Inglês é o idioma de controle desta página. Na medida que haja algum conflito entre o texto original em Inglês e a tradução, o Inglês prevalece.
Ao clicar no link de tradução, um serviço gratuito de tradução será ativado para converter a página para o Português. Como em qualquer tradução pela internet, a conversão não é sensivel ao contexto e pode não ocorrer a tradução para o significado orginal. O serviço de Extensão da Carolina do Norte (NC State Extension) não garante a exatidão do texto traduzido. Por favor, observe que algumas funções ou serviços podem não funcionar como esperado após a tradução.
English
English is the controlling language of this page. To the extent there is any conflict between the English text and the translation, English controls.
Clicking on the translation link activates a free translation service to convert the page to Spanish. As with any Internet translation, the conversion is not context-sensitive and may not translate the text to its original meaning. NC State Extension does not guarantee the accuracy of the translated text. Please note that some applications and/or services may not function as expected when translated.
Collapse ▲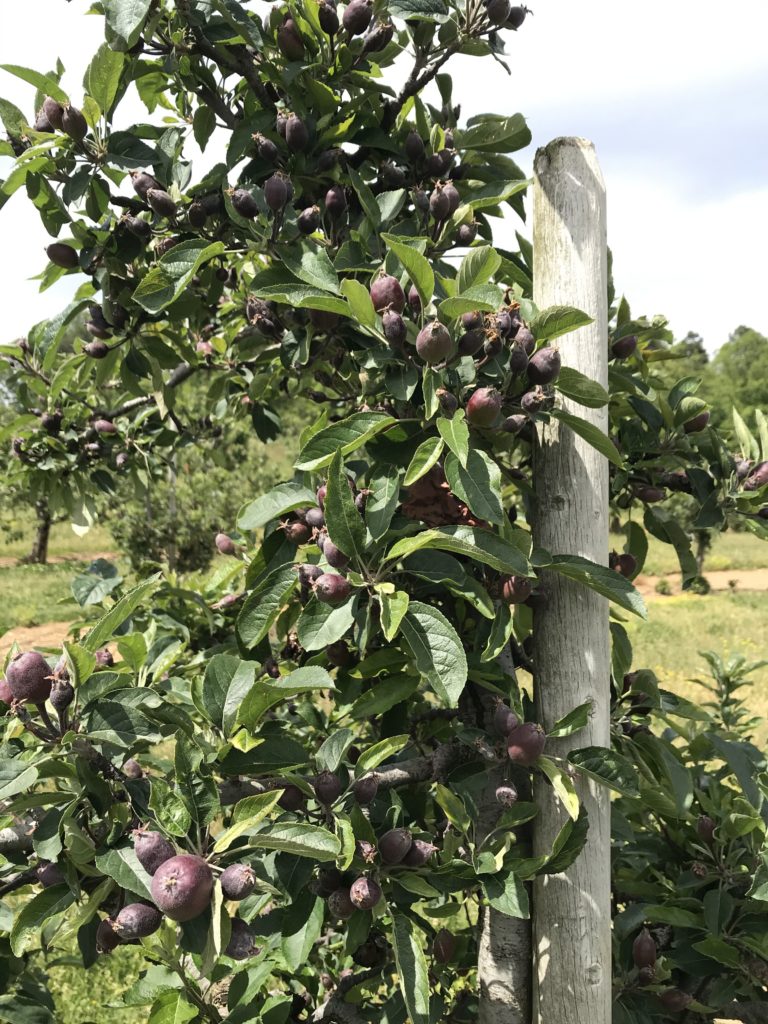
Excessive fruit set on ‘Red Delicious’. With large fruit (>18 mm) options for chemical thinning become more limited and volatile.
Challenging… Frustrating… Atypical…
I’ve used all of these words – and some colorful language – to describe the 2020 chemical thinning window. Unseasonably cool temperatures have been a major limitation in post-bloom thinner efficacy. When temperatures have been acceptable, we had very short periods of opportunity for chemical thinner applications, largely due to near constant, Nebraska-like winds.
To complicate matters, most sites in the southeast observed several frost/freeze events. There is widespread variation in fruit set due to these cold events. Some blocks are exhibiting sub-lethal cold injury, such as frost rings, russet, and seed damage. Blocks that have evidence of cold injury are generally more sensitive to chemical thinner applications – rates may need to be reduced to avoid over-thinning. Please check for seed/fruit damage before making additional thinning applications.
Another challenging factor is that cool weather has delayed the visible response of previous chemical thinner applications. In orchards that received post-bloom thinner applications 2 weeks ago, very few fruit have fallen from the canopy. With minor agitation, some abscising fruit can be detached from the tree. In some cases however, there are some fruit that appear weak/stunted that seem to be firmly attached and have healthy seeds. It is very challenging to determine if these fruit are abscising or persisting without detailed monitoring of fruit growth and development.
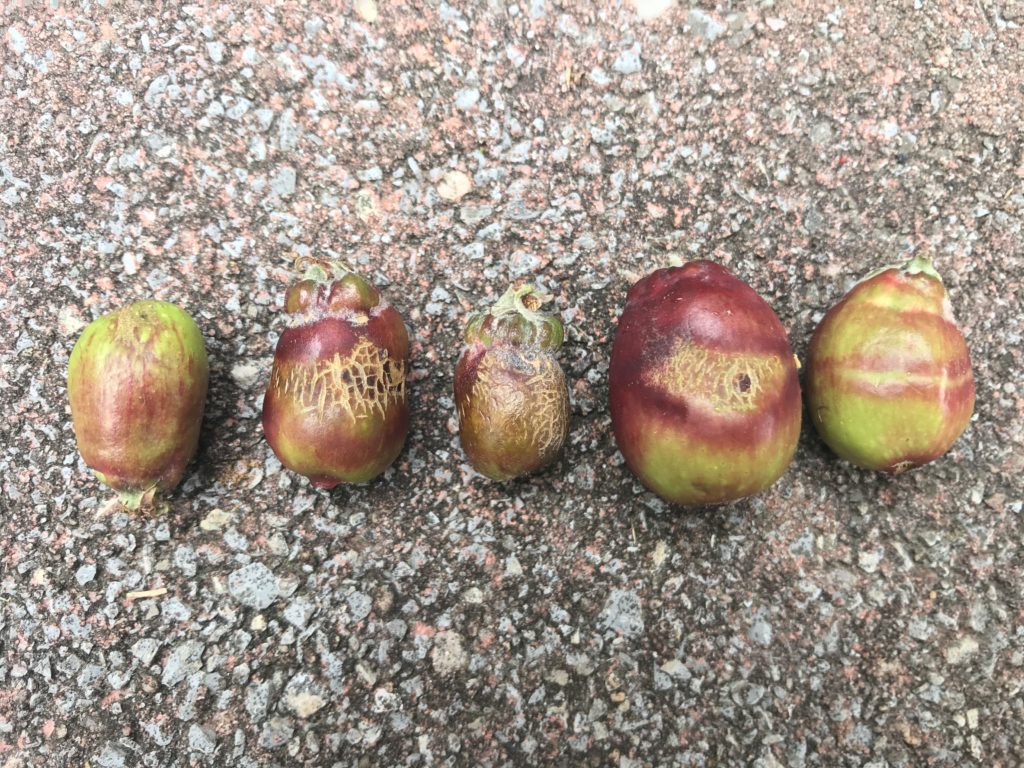
With several frost/freeze events in 2020, some fruit/blocks are exhibiting sub lethal cold injury, such as frost rings, russet, and seed damage.
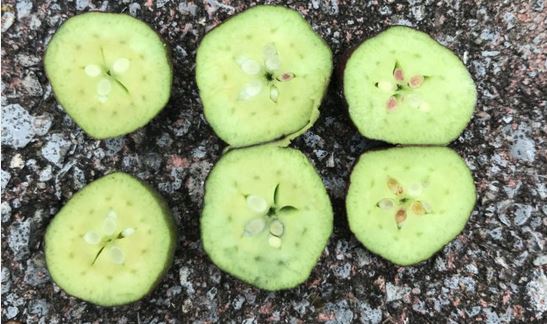
Seed damage (note discolored/aborted seeds in fruit at center and right) has been observed in several orchards. Be sure to check for seed/fruit damage before making additional chemical thinner applications.
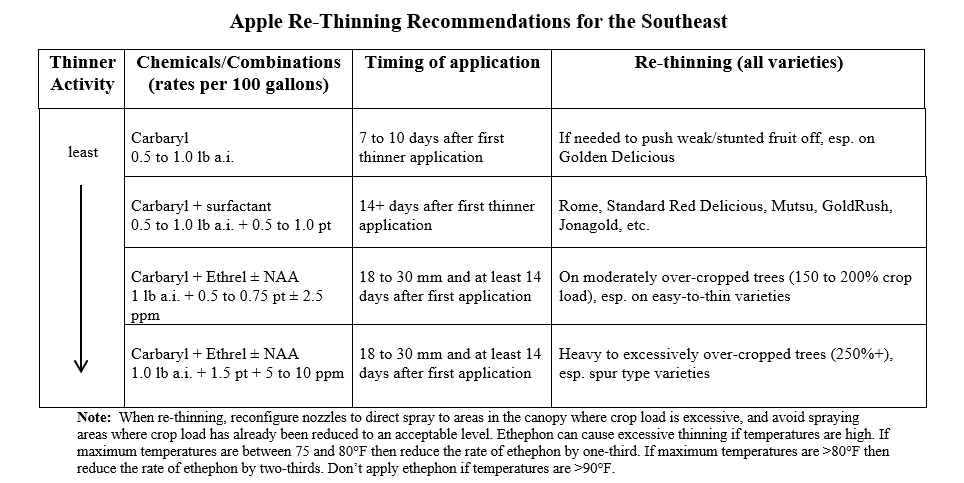
Per the forecast, one of the “better” opportunities for post bloom thinner activity in 2020 will occur over the next few days. While ‘Rome’ is in the post bloom thinning window (8-14 mm diameter), most varieties are at a stage of development (>18 mm) that key post bloom chemical thinners (6-BA and NAA) have poor/limited activity. With large fruit (>18 mm) options for chemical thinning become more limited and volatile. If more than a minor reduction of crop load is needed, then thinning programs including ethephon are generally required. Ethephon has the reputation of being an erratic thinner – some of my colleagues from more northern growing regions refer to this as the “elephant gun” of chemical thinners. For better or worse, many growers will need to rely on this tool to re-thin significant acreage in the southeast.
A few comments about thinning with ethephon:
- This chemistry is very temperature dependent. Mild/poor thinning activity is observed in the 60’s; good thinning activity is observed in the 70’s to low 80’s; and aggressive responses are observed in the mid to upper 80’s. Ethephon should not be applied if daily high temperatures exceed 90 degrees F.
- The thinning response from ethephon is very localized – sections of the canopy that do not receive thinner will not show a response. Good spray coverage is essential for a consistent response. Since fruit set is generally stronger in the upper 2/3’s of the canopy, directing the majority of the spray material to the upper canopy is generally advisable.
- Some varieties are far more sensitive (Golden Delicious and Rome) to ethephon when compared to others (Red Delicious and Fuji). Rate selection is dependent on cultivar sensitivity and current fruit set.
- The pH of the spray solution should be between 3 to 5 for optimal product performance. If you have alkaline (high pH) water, an acidifying surfactant or buffering agent is recommended.
See guidelines from the 2020 Integrated Orchard Management Guide for Commercial Apples in the Southeast (below). While developed for another region, another nice resource for rescue thinning was developed by researchers at University of Massachusetts and Rutgers University.
Running the Carbon Balance Model
Output from the Carbon Balance Model for four sites in western NC (Apple Wedge, Flat Rock, Sugarloaf, and Morganton) and two sites in North Georgia (Blue Ridge and Ellijay) is below.
If you have access to NEWA, I highly recommend calculating the carbon balance for your own site. Predicted weather data is used in these estimates and the forecast can change throughout the course of a day. If you’d like to run the model on your own, the link at the NEWA site is on the drop-down menu under “Crop Management”. Choose a site nearest your orchard location and enter your Green Tip and Full Bloom date. If using the 2019 version of the model, select the % of flowering spurs that is most appropriate for the block(s) you plan to thin. Then select the green “Calculate” button.
It is very likely that if you run the model on your own, you will observe different and more accurate output. Potential reasons for this deviation in output includes:
1) Use of different model versions. I am reporting data from the 2019 version of the model and selected 50-75% flowering spurs.
2) Different green tip/bloom dates used.
3) Model output is based on forecast data, so the output will change as the forecast changes (a key incentive to run this on your own, if possible).
North Carolina
Edneyville, NC (Apple Wedge)
| 5.13.20: Edneyville (Apple Wedge) Apple Carbohydrate Thinning Model Results | ||||||
| Date | Max Temp | Min Temp | Solar Rad | Tree Carbohydrate Balance (g/day) | Accum Degree Days | |
| (°F) | (°F) | (MJ/m2) | Daily | 7-Day Ave | (since bloom) | |
| 13-May | 64 | 46 | 11.6 | 9.39 | 23.9 | 344 |
| 14-May | 73 | 52 | 22.6 | 25.09 | 12.09 | 356.9 |
| 15-May | 76 | 56 | 21.8 | 9.27 | 6.23 | 371.8 |
| 16-May | 81 | 58 | 23.1 | -1.51 | – | 388.6 |
| 17-May | 82 | 61 | 22.7 | -11.88 | – | 406.6 |
| 18-May | 78 | 55 | 18.6 | -1.65 | – | 421.7 |
| 19-May | 77 | 56 | 23.6 | 14.9 | – | 436.9 |
Edneyville, NC (Sugarloaf Mtn)
| 5.13.20: Edneyville (Sugarloaf Mtn) Apple Carbohydrate Thinning Model Results | ||||||
| Date | Max Temp | Min Temp | Solar Rad | Tree Carbohydrate Balance (g/day) | Accum Degree Days | |
| (°F) | (°F) | (MJ/m2) | Daily | 7-Day Ave | (since bloom) | |
| 13-May | 61 | 46 | 11.2 | 10.53 | 25.66 | 315.2 |
| 14-May | 73 | 51 | 23 | 26.74 | 14.24 | 327.9 |
| 15-May | 76 | 55 | 21.8 | 11.03 | 8.47 | 342.5 |
| 16-May | 80 | 57 | 23.6 | 4.42 | – | 358.8 |
| 17-May | 82 | 61 | 22.8 | -11.17 | – | 376.7 |
| 18-May | 79 | 54 | 19.1 | 0.63 | – | 391.9 |
| 19-May | 76 | 56 | 23.6 | 17.12 | – | 406.8 |
Flat Rock, NC
| 5.13.20: Flat Rock Apple Carbohydrate Thinning Model Results | ||||||
| Date | Max Temp | Min Temp | Solar Rad | Tree Carbohydrate Balance (g/day) | Accum Degree Days | |
| (°F) | (°F) | (MJ/m2) | Daily | 7-Day Ave | (since bloom) | |
| 13-May | 63 | 45 | 11.4 | 11.77 | 25.11 | 331.1 |
| 14-May | 74 | 52 | 23.1 | 24.31 | 14.42 | 344.3 |
| 15-May | 76 | 55 | 21.5 | 10.34 | 8.62 | 358.9 |
| 16-May | 80 | 57 | 23.3 | 3.88 | – | 375.2 |
| 17-May | 82 | 61 | 22.9 | -10.87 | – | 393.2 |
| 18-May | 79 | 54 | 19.3 | 1.28 | – | 408.3 |
| 19-May | 76 | 55 | 23.8 | 19.6 | – | 422.9 |
Morganton, NC
| 5.13.20: Morganton (Apple Hill Orchard) Apple Carbohydrate Thinning Model Results | ||||||
| Date | Max Temp | Min Temp | Solar Rad | Tree Carbohydrate Balance (g/day) | Accum Degree Days | |
| (°F) | (°F) | (MJ/m2) | Daily | 7-Day Ave | (since bloom) | |
| 13-May | 64 | 46 | 10.6 | -4.09 | 5.32 | 388.2 |
| 14-May | 79 | 52 | 24 | 6.01 | -6.34 | 402.8 |
| 15-May | 81 | 57 | 21.9 | -13.04 | -15.63 | 419.4 |
| 16-May | 86 | 60 | 23.3 | -27.48 | – | 438.2 |
| 17-May | 87 | 63 | 22.7 | -38.14 | – | 458.1 |
| 18-May | 85 | 56 | 20.2 | -23.52 | – | 475.4 |
| 19-May | 82 | 57 | 23.7 | -9.13 | – | 492.3 |
Georgia
Blue Ridge, GA
| Predicted Thinning Index: 5.13.20 Blue Ridge, GA | ||||
| Date | Days after bud break | High Temperature (F) | Carbon Balance (g/day) | Thinning Index |
| 13-May | 55 | 73 | -30.1 | -21.54 |
| 14-May | 56 | 78 | -26.0 | -21.41 |
| 15-May | 57 | 79 | -8.5 | -27.52 |
| 16-May | 58 | 81 | -29.7 | -30.64 |
| 17-May | 59 | 83 | -44.4 | -14.37 |
| 18-May | 60 | 77 | -17.8 | 8.54 |
| 19-May | 61 | 71 | 19.1 | — |
| 20-May | 62 | 74 | 24.3 | — |
Ellijay, GA
| Predicted Thinning Index: 5.13.20 Ellijay, GA | ||||
| Date | Days after budbreak | High Temperature (F) | Carbon Balance (g/day) | Thinning Index |
| 13-May | 55 | 76 | -25.5 | -23.2 |
| 14-May | 56 | 79 | -30.5 | -27.5 |
| 15-May | 57 | 79 | -13.6 | -34.9 |
| 16-May | 58 | 82 | -38.2 | -37.8 |
| 17-May | 59 | 85 | -52.8 | -20.3 |
| 18-May | 60 | 78 | -22.5 | 3.7 |
| 19-May | 61 | 73 | 14.3 | — |
| 20-May | 62 | 75 | 19.1 | — |
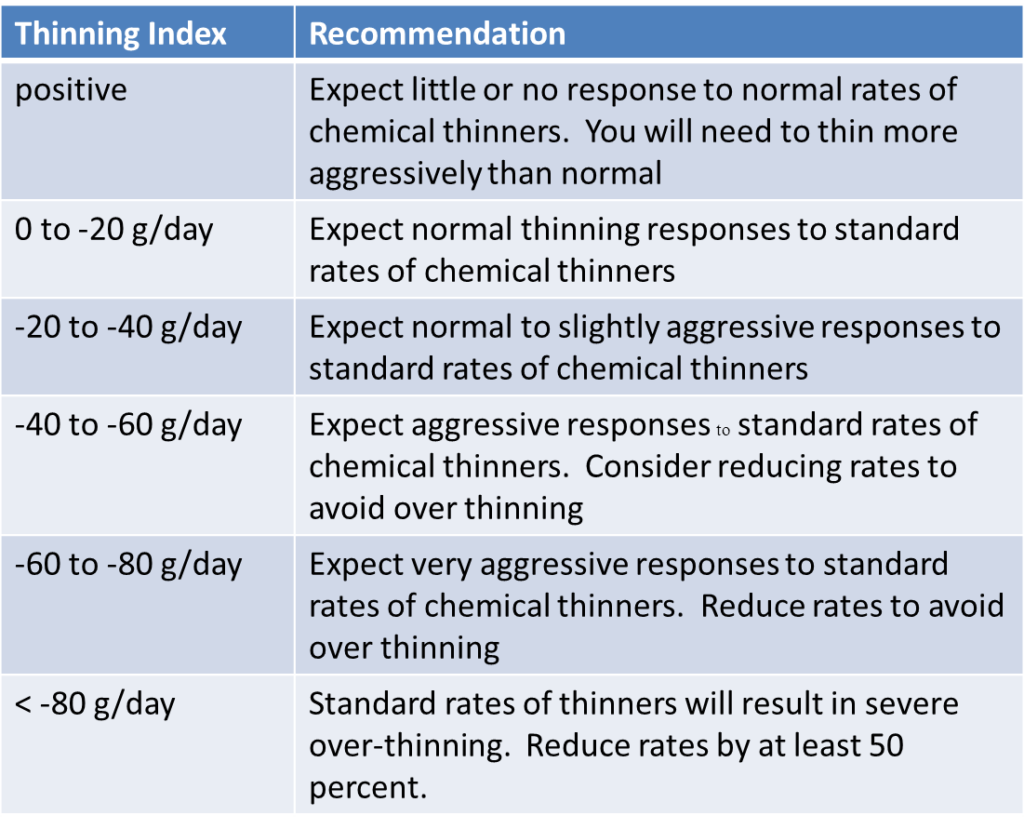
Thinning Index (For GA sites)
Notes on Using Output from the Carbon Balance Model
The Apple Carbohydrate Balance Model is a useful tool in making chemical thinning decisions. This model was not developed to account for all factors that influence the efficacy of a thinner application; it was developed to estimate the carbohydrate status of the tree. In short, the carbohydrate balance model is a valuable tool, but other factors need to be considered when making a chemical thinning decision.
A positive carbohydrate balance makes it more difficult to thin whereas increasing carbohydrate deficits are predicted to increase the response to chemical thinning sprays. For example, you might respond to a predicted carbohydrate surplus or mild deficit by either adopting a more aggressive approach to chemical thinning or by waiting until more ideal conditions for thinning develop. Alternatively, if the model is predicting a severe carbohydrate deficit then you might consider reducing the rate of chemical thinner or perhaps not applying a thinner at that time for risk of over-thinning.


